
Stokes’ theorem intuition | Multivariable Calculus
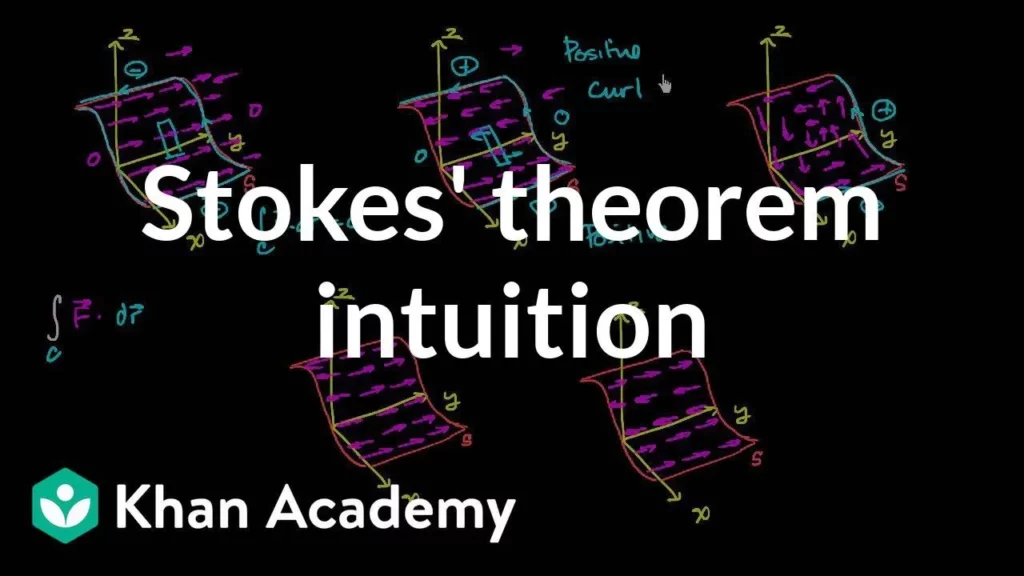
This lesson delves into the relationship between line integrals and the curl of vector fields, illustrating how the curl influences the value of these integrals through various examples. It culminates in the introduction of Stokes’ Theorem, which establishes that the line integral of a vector field around a closed curve is equal to the surface integral of the curl of that vector field over the surface bounded by the curve. Through this exploration, we gain a deeper understanding of the interplay between line integrals and curl in vector calculus.
Representing structures of organic molecules | Biology

This lesson focuses on the fundamentals of organic chemistry notation and nomenclature, emphasizing the importance of understanding carbon chains and their representations. It introduces various methods for depicting carbon compounds, such as Lewis structures, structural formulas, and line-angle diagrams, highlighting their utility in simplifying complex molecular structures. Mastering these notational techniques provides a solid foundation for further study in organic chemistry.
Two-sample t test for difference of means | AP Statistics
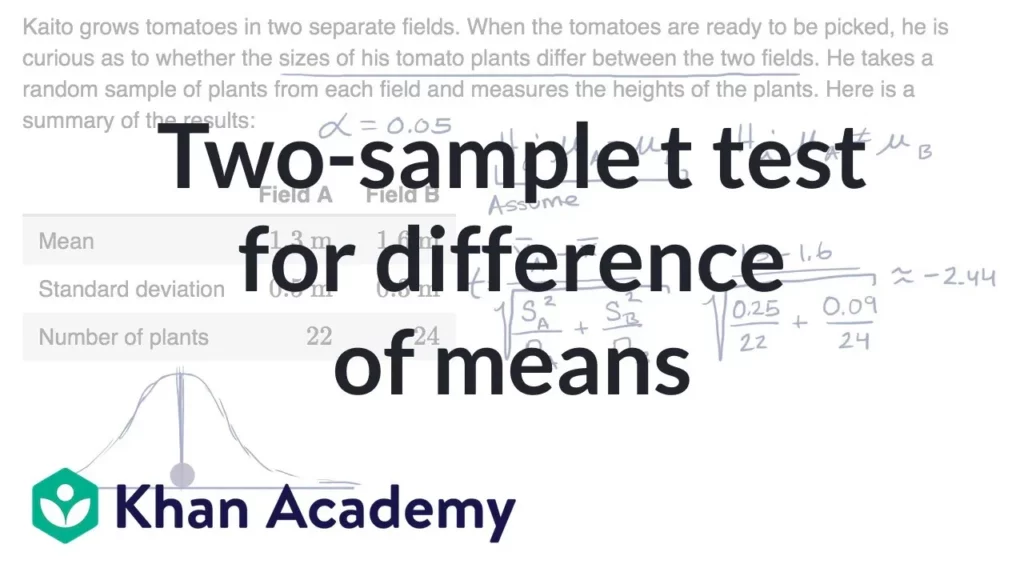
In this lesson, Kaito conducts a two-sample T-test to determine if there is a significant difference in the heights of tomato plants between two fields. By setting up null and alternative hypotheses, ensuring the validity of the test through specific assumptions, and calculating the T statistic and P-value, Kaito finds that the P-value (0.048) is less than the significance level (0.05), leading to the rejection of the null hypothesis and confirming a statistically significant difference in plant heights.
Restricting domain of trig function to make invertible | Trigonometry

In this lesson, we explored the conditions under which the function \( f(x) = \cos(x) – \frac{\pi}{4} \) can be made invertible by restricting its domain. We learned that a function is invertible if it passes the horizontal line test, meaning each range value corresponds to a unique domain value. Through analysis of various intervals, we determined that the interval \( ( \pi/2, 5\pi/4) \) allows for the function to be invertible, enabling the construction of an inverse function.
Limit examples (part 1) | Limits | Differential Calculus
The lesson on “Understanding Limits” introduces the concept of limits in calculus, emphasizing their role in analyzing function behavior as they approach specific points. Through examples, such as finding the limit of \( f(x) = \frac{2x + 2}{x + 1} \) as \( x \) approaches -1 and \( f(x) = \frac{1}{x} \) as \( x \) approaches 0, the lesson illustrates the importance of both direct substitution and graphical representation in determining limits, leading to conclusions about defined and undefined limits. Ultimately, it highlights the necessity of using various approaches to gain a comprehensive understanding of limits.
Angle basics | Angles and intersecting lines | Geometry
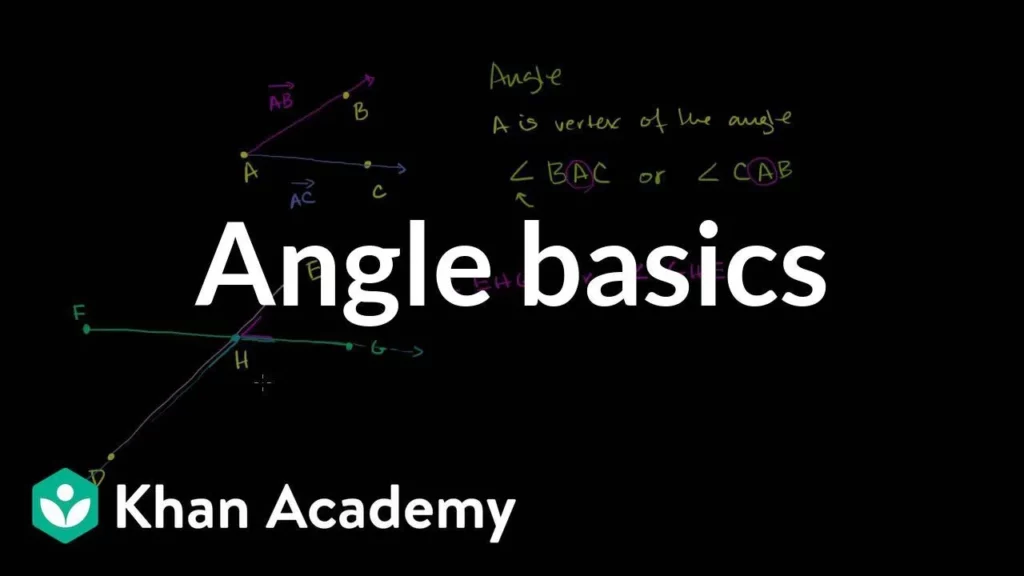
In this lesson, students learn about angles, which are formed by two rays meeting at a point called the vertex. They discover how to name angles using three points for clarity and explore the importance of specificity in identifying different angles. The lesson sets the stage for future learning about measuring angles and their applications in geometry.
Statistics intro: Mean, median, and mode | Data and statistics | 6th grade
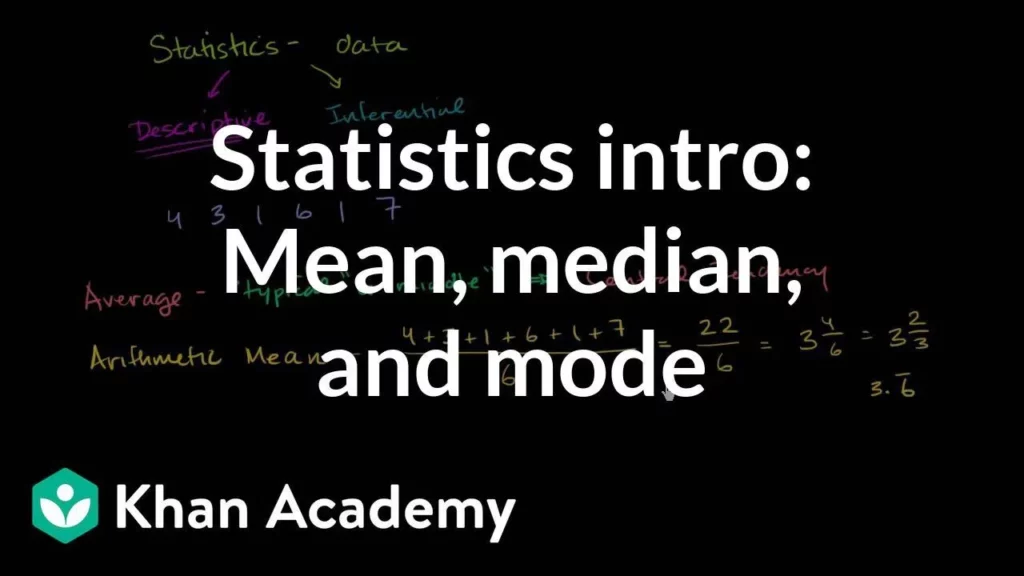
The lesson introduces the fundamentals of statistics, emphasizing its role in summarizing and analyzing data through descriptive statistics and measures of central tendency. It explains how the arithmetic mean, median, and mode serve as key tools to represent datasets, providing different perspectives on the data’s central value. Understanding these concepts lays the groundwork for deeper exploration into more complex statistical ideas.
Statistics: Sample variance | Descriptive statistics | Probability and Statistics
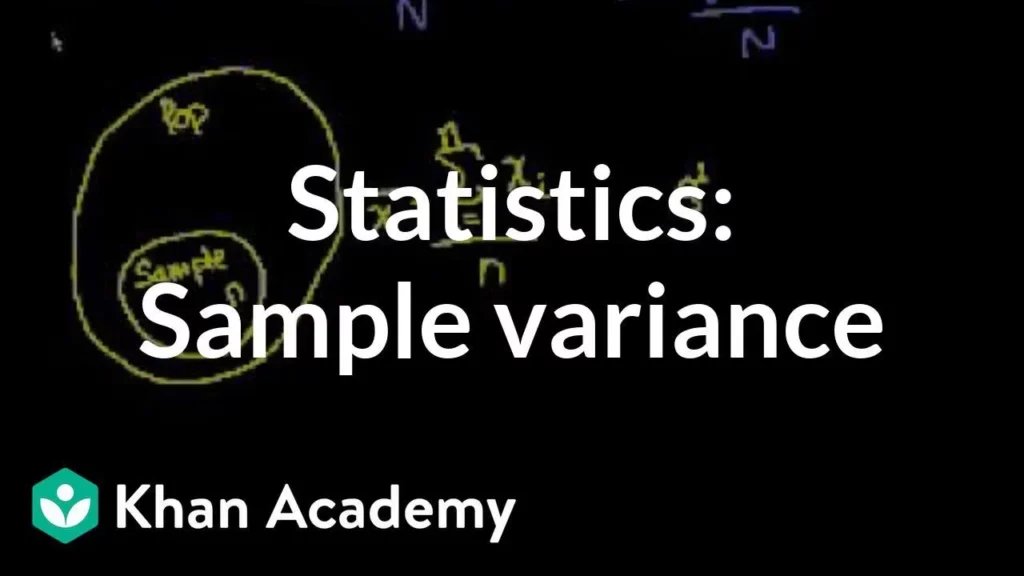
This lesson focuses on the concept of variance in statistics, highlighting the differences between population variance and sample variance. It explains how variance measures the spread of data points around the mean and outlines the formulas for calculating both types, emphasizing the need for an unbiased sample variance formula to avoid underestimating population variance when working with samples. Understanding these distinctions is crucial for accurate statistical analysis and inference.
Circular flow of income and expenditures | Macroeconomics
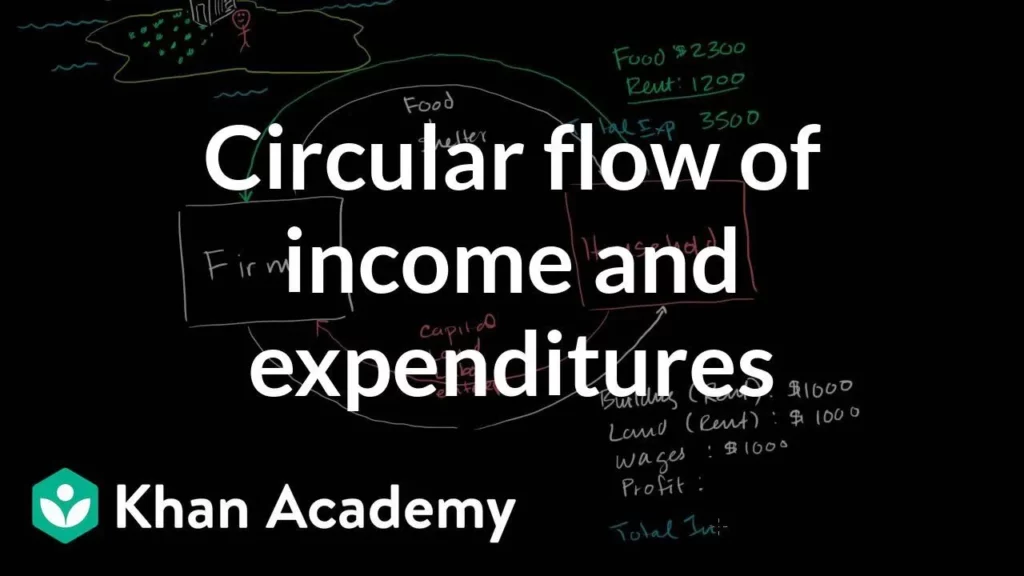
This lesson illustrates the circular flow of goods and services through a simplified example of an isolated economy on an island, where a single individual acts as both the household and the firm. The individual provides resources to the firm and receives income in return, while the firm generates revenue by selling goods and services, creating a balanced loop of income and spending. This foundational understanding sets the stage for exploring more complex economic systems involving multiple households and firms.
Solving a consecutive integer problem algebraically | Linear equations | Algebra I
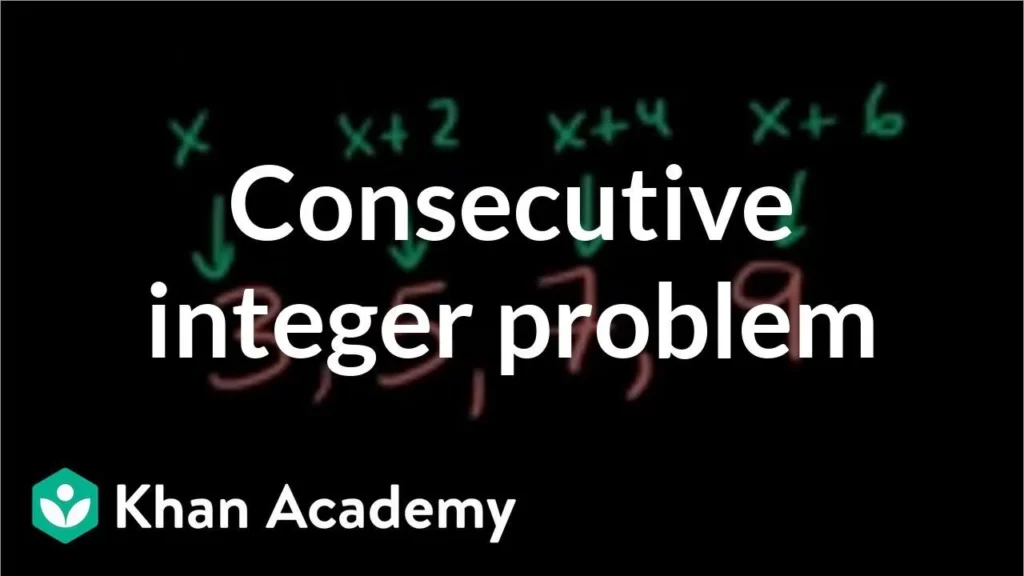
In this lesson, we learned how to find four consecutive odd integers that sum to 136 by defining the smallest integer as \( x \) and expressing the subsequent integers as \( x + 2 \), \( x + 4 \), and \( x + 6 \). By setting up the equation \( x + (x + 2) + (x + 4) + (x + 6) = 136 \) and solving for \( x \), we determined that the integers are 31, 33, 35, and 37. This approach demonstrates how to effectively tackle similar math problems involving consecutive odd numbers.